Last-Mile Warehouse Acquisition: Underwriting a 110,000 SF Distribution Facility in Dallas-Fort Worth
A 110,000 SF infill distribution facility underwritten on drive-time coverage rather than building size — and why the smaller box outperforms the larger one further out.
This acquisition profile examines asset strategy, underwriting method, transaction structure, and value-creation considerations. Counterparty and pricing details are not disclosed.
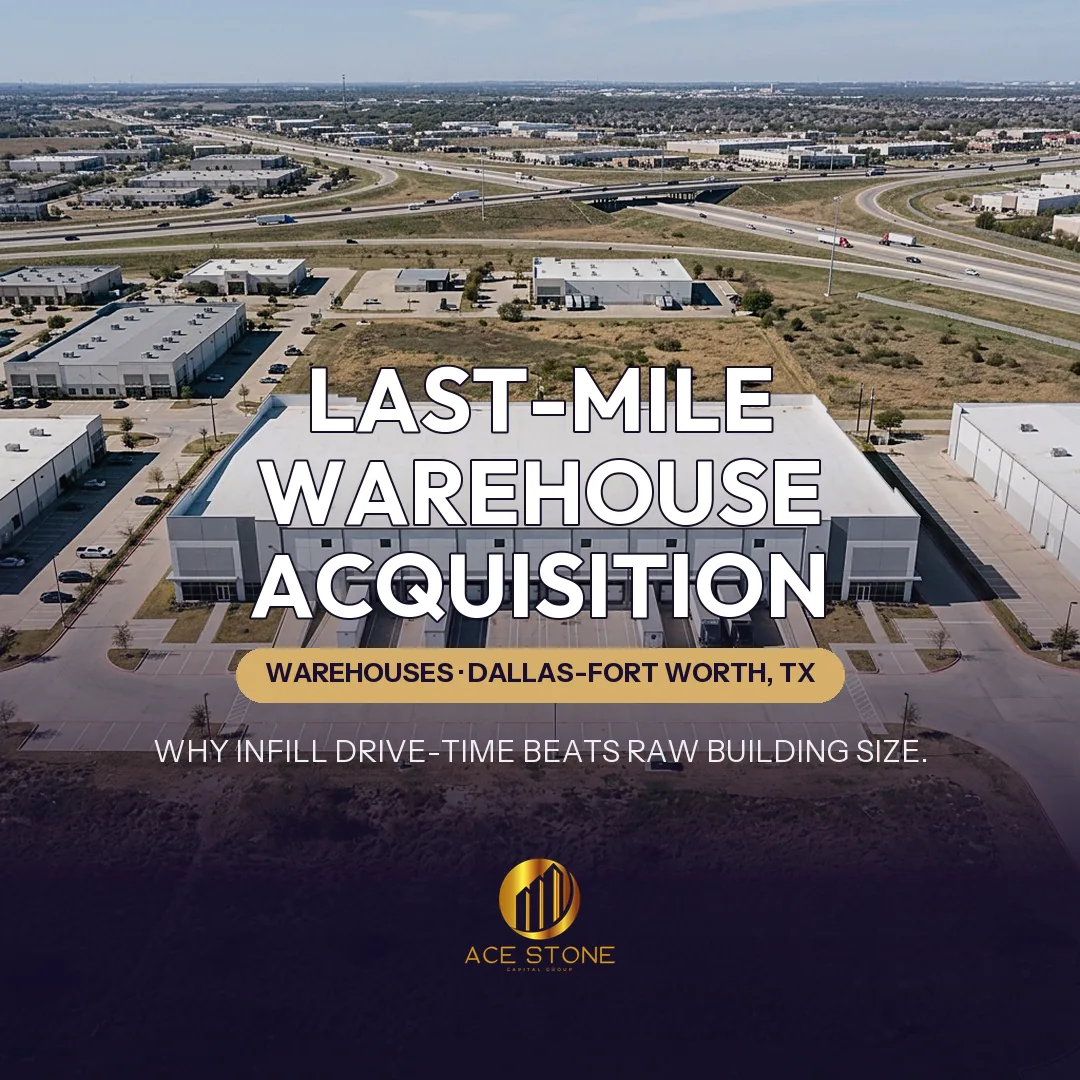
Representative imagery of the asset type and market — not a photograph of the subject property.
Case Context
This acquisition profile examines AceStone Capital Group's underwriting method for an asset of this type. Specific properties, counterparties, and pricing are not identified. The subject profile is a 110,000 square foot distribution facility inside the Dallas-Fort Worth urban envelope, positioned within a short drive of several large residential concentrations. All figures below are underwriting assumptions used to demonstrate method.
Executive Summary
The asset is smaller and older than the modern bulk product being delivered on the metro's periphery, and its asking price per square foot is higher. On a conventional size-and-vintage screen it looks expensive. Underwritten on the metric that governs last-mile leasing demand — population reachable inside a delivery drive-time window, against replacement supply that cannot practically be built at that location — it prices more attractively than the larger, cheaper box thirty minutes out. Location scarcity, not square footage, carries the income.
A last-mile occupier is not buying storage volume; it is buying the cost and speed of the final delivery leg. That cost is driven by route density, driver hours and fuel, all of which scale with distance from the customer, not with the size of the building. A tenant will accept a lower ceiling, a tighter truck court and a higher rent per square foot if the location removes miles from every route it runs. The corollary matters for underwriting: the rent premium at an infill location is durable because it is grounded in the tenant's operating cost, not in a leasing cycle.
Physical Asset Profile
The profile assumed here is a rear-load building of roughly 110,000 square feet with clear height in the range typical of an earlier generation of distribution product, a dock-high door count sufficient for parcel and regional operations, drive-in access at one end, a truck court depth that supports maneuvering but not extended trailer storage, and a car park sized closer to a labour-intensive sortation use than to a lightly-staffed bulk operation. Column spacing, bay depth and floor slab condition are recorded as they materially affect rack layout and therefore which tenants can use the building at all.
Access is scored on practical, not map, terms: distance and turning movements to the nearest highway ramp, whether trucks can reach the site without traversing residential streets or signalized bottlenecks, peak-hour queue behaviour at the intersections a driver actually uses, and whether the surrounding street network imposes weight or hour restrictions. A building one mile from an interstate with a poor egress geometry can perform worse than one two miles away with a clean truck route.
Market Context and Competing Supply
The relevant competitive set is not the metro vacancy rate. It is the inventory of buildings of similar size, loading and clear height inside the same drive-time band. New industrial construction in a metro like Dallas-Fort Worth is concentrated where land is available and cheap, which is by definition further from the consumer. The analysis therefore separates two supply pictures: substantial deliveries in the outer submarkets, and a materially constrained pipeline of infill product where land is scarce, expensive and often already improved.
In-place rent is compared against benchmark market rent for the size and loading class inside the same drive-time band, with the gap expressed both as a percentage and as an annual dollar figure so its materiality is visible. Occupancy is modelled with a general vacancy allowance and a credit-loss allowance rather than assuming a full building indefinitely. Escalations are examined for whether they compound off a base near, above or below market, because a fixed escalator on an already-above-market rent shortens the effective lease.
Acquisition Basis and Replacement Cost
Basis is expressed three ways: price per square foot, capitalization rate on stabilized net operating income, and price relative to an estimated cost to replicate. Replacement cost is built from land value at that location plus current construction cost plus soft costs and a developer return — and the land component is the point. Where land inside the drive-time band prices at a large multiple of land on the periphery, replacement cost for an infill building sits well above the acquisition basis, and that spread is the structural protection in the trade.
Operating Assumptions and CapEx
Operating expenses are modelled at property level with real estate taxes reassessed at the purchase price rather than carried forward at the seller's assessment — a routine and material error in industrial underwriting. Insurance is priced at current market rather than the expiring policy. Roof age and remaining life, pavement condition in the truck court, dock equipment condition, LED retrofit opportunity and fire protection adequacy each carry a capital reserve. Landlord recovery structure is checked line by line, because a nominally triple-net lease with caps and exclusions is not fully net.
Scenario and Sensitivity Analysis
Three scenarios are carried. In the base case the tenant renews at market with modest downtime and a normal allowance package. In the downside the tenant vacates, the building sits through an extended marketing period, and re-leasing costs include tenant improvements, commissions and free rent, with taxes, insurance and maintenance carried by ownership throughout. In the upside the rent gap is captured on a shorter timeline and the building attracts a user willing to pay for the location. Each is then flexed for exit capitalization rate movement in both directions.
Risk Analysis
The principal risks are functional rather than locational: clear height below what a growing share of occupiers specify, a truck court that limits trailer parking, and a car park that constrains staffing-heavy operations. Each narrows the tenant pool. Against them sit the location's barriers to new supply. The underwriting question is whether the functional discount is already reflected in the price and whether modest capital — pavement, dock upgrades, lighting, yard reconfiguration — can widen the pool at reasonable cost.
Exit Considerations
Exit is modelled on stabilized net operating income at a capitalization rate consistent with an infill asset of this vintage, not at the rate the entry was priced on. A second exit path is tested — sale to a user-buyer, who values proximity and control differently to an income buyer and often clears at a higher price per square foot. The presence of a credible second buyer pool is itself a valuation input, and infill locations have one where peripheral bulk product typically does not.
Acquisition Decision
On these underwriting assumptions the asset supports acquisition at a basis meaningfully below replacement cost, with the rent gap providing a defined path to stabilized yield and the location providing supply protection the outer submarkets cannot offer. The decision is conditional on capital reserves for roof and pavement being funded at closing rather than deferred, and on the tax reassessment being modelled correctly at the purchase basis.
Key Takeaways
Size is an operating characteristic; location is an economic one. Compare buildings on the population they can serve within a delivery window and on the cost to replicate them at that point, not on price per square foot alone. Where land scarcity prevents new supply, a functionally imperfect building can carry stronger and more durable economics than a superior building in a location anyone can rebuild.
What This Case Shows
A structured example of how AceStone Capital Group sources, underwrites, and structures off-market commercial acquisitions in Dallas-Fort Worth, TX. For broader context, see our active acquisition markets or initiate a direct-sale review for a similar property.
Have a Property to Sell?
Receive a written offer or a clear pass within 1–2 business days.